Footwear Exports Reach 11.46 Million Pairs in January
In January, the average price per exported pair was USD 7.71, down 12.6% from the same month in 2024 (USD 8.82)

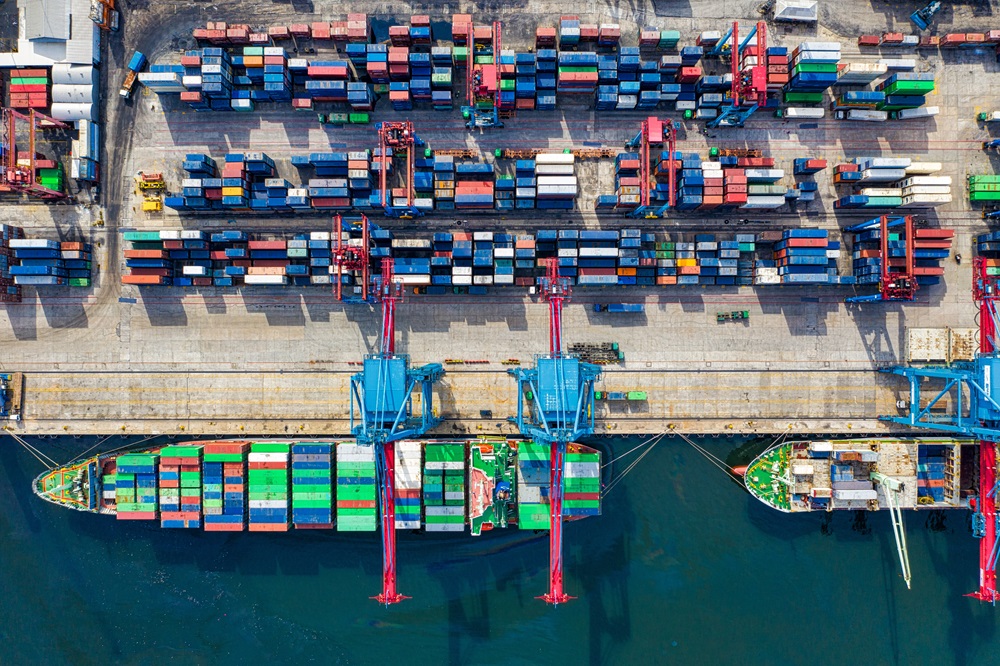
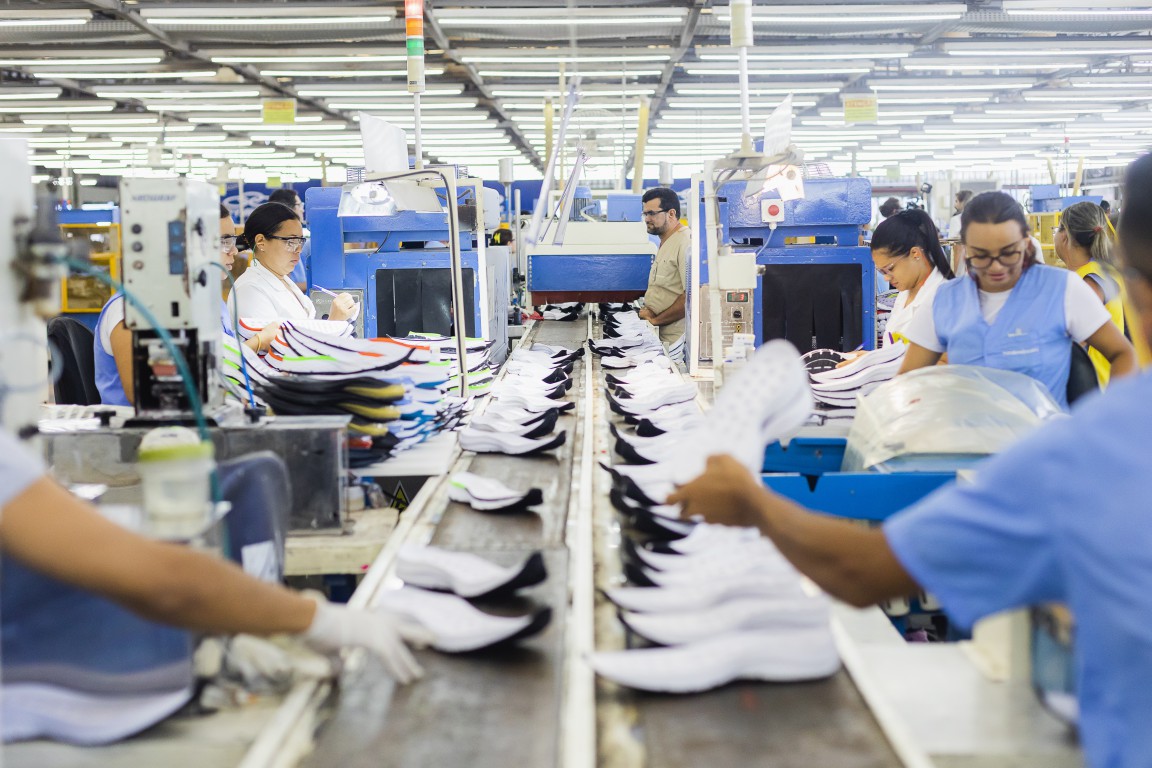
Data compiled by the Brazilian Footwear Industries Association (Abicalçados) shows that 11.46 million pairs were shipped abroad in January, generating USD 88.3 million. The figures represent an increase in volume (+11.4%) but a decline in revenue (-2.7%) compared to the first month of last year. According to the association, this reflects a slight recovery from a weak base in 2023, driven by the growth of flip-flops in the export mix and the depreciation of the Brazilian real against the US dollar, which makes exports more competitive. In January, the average price per exported pair was USD 7.71, down 12.6% from the same month in 2024 (USD 8.82).
Abicalçados’ Executive President, Haroldo Ferreira, points out that the international scenario remains unchanged from late last year, marked by economic uncertainties now compounded by the possibility of a trade war between the United States and China. "The outlook for 2025 is uncertain. While the tariff imposed by Trump on Chinese footwear could benefit Brazil in the U.S. market, these Chinese-made shoes are likely to flood key markets for our products abroad, particularly in Latin America," he explains. Ferreira notes that, despite the increase in volume, January’s export levels remained below the five-year annual average (12.23 million pairs), indicating continued "weak international demand."
Destinations
In January, the United States remained the main destination for Brazilian footwear, with 1.13 million pairs shipped, generating USD 19 million—an increase of 4.2% in volume but an 11.5% drop in revenue. Argentina followed, with 635,600 pairs and USD 10.36 million, up 14.2% in volume but down 6.3% in revenue compared to the same month in 2024. France ranked third, importing 380,600 pairs for USD 4.9 million, marking increases of 14.7% and 54.3%, respectively.
Exporting States
In the first month of 2025, Rio Grande do Sul led Brazilian footwear exports, shipping 2.62 million pairs and generating USD 37.6 million, representing declines of 12.1% in volume and 17.5% in revenue compared to January 2024. Ceará ranked second, with 5 million pairs and USD 27.42 million—up 34.8% in volume and 30.3% in revenue from 2024. São Paulo followed, exporting 514,100 pairs and generating USD 7.2 million, reflecting a 23.5% increase in volume and a 2.7% drop in revenue.
Imports Continue to Rise
Following the trend seen in 2024, when footwear imports grew by more than 26% in volume, foreign footwear inflows continued to rise in January. During the month, Brazil imported 3.32 million pairs worth USD 47.96 million, reflecting increases of 18.1% in volume and 29% in revenue compared to the same period in 2024.
Asian countries remained the main sources of imports, accounting for 90% of all foreign footwear entering Brazil. Vietnam led the ranking in January, with 1.24 million pairs imported for USD 22.47 million, up 55% in volume and 31% in revenue from January 2024. Indonesia followed, with 742,500 pairs and USD 12 million—showing significant increases of 113.5% and 111.6%, respectively, compared to last year. China ranked third, supplying 719,800 pairs for USD 5 million, a 34.7% drop in volume but a 16.6% increase in revenue.
For footwear components—such as insoles, soles, and heels—January imports totaled USD 5.53 million, up 47% from the same period in 2024. The main suppliers were China, Paraguay, and Vietnam.


-thumb.jpg)
-thumb.jpg)

-thumb.jpg)
-thumb.jpg)